The ‘Quick & Dirty’ About OEE

By Daniel Penn Associates, LLC
 Much has been written about Overall Equipment Effectiveness (OEE), but it is too useful not to revisit some of the key points. OEE is a great way to see the impact of the six big losses, aka waste, the elimination of which is the goal of lean manufacturing.
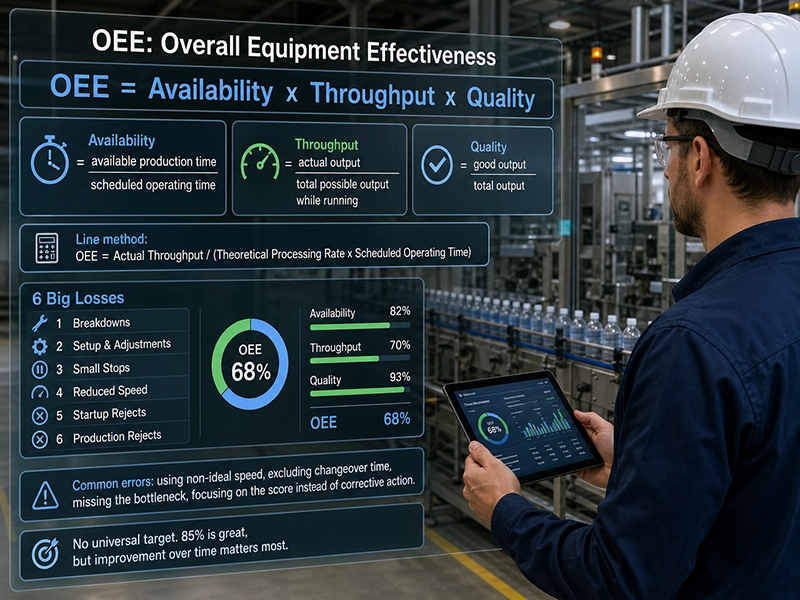
The 6 Big Losses are:
- Breakdowns
- Setup and Adjustments
- Small Stops
- Reduced Speed
- Startup Rejects
- Production Rejects
Standard Formula
You can calculate OEE in at least two simple ways, depending on the information you are starting with. The standard formula is: OEE = %A x %T x %Q, where
- %A (Availability) is the ratio of the time the equipment was available for production to the scheduled operating time, and
- %T (Throughput) is the ratio of the actual output to the total possible output while equipment is running, and
- %Q (Quality) is the ratio of good output to total output.
Throughput Ratio Method
A second method, the Throughput Ratio method, is handy for assessing an overall process or line. OEE = (AT)/(TPR x SOT), where
- AT (Actual Throughput) is the amount of good product produced, and
- TPR (Theoretical Processing Rate) is the processing rate of the system’s bottleneck under ideal conditions, and
- SOT (Scheduled Operating Time) is the amount of time the system is not scheduled to be idle (includes production and maintenance).
Common Errors
Here are a few common errors that prevent OEE from delivering its full value as a key performance indicator:
- Not using the ideal equipment speed or cycle time – If you use anything else, such as a budgeted or average rate or speed, it makes it difficult to see the real impact the 6 Big Losses have on performance. You are setting the bar too low.
- Not including change over time – this is a common mistake because people argue that changeover is not processing, which is true, but our objective is to improve throughput, and every minute spent on changeover is a minute not spent on throughput.
- Not recognizing the bottleneck on a line – the second method for calculating OEE above works well for a production line, provided you recognize the bottleneck. It should go without saying that the bottleneck sets the pace for the entire line, so the meaningful OEE for the line must be based on the throughput at the bottleneck.
- Focusing on the OEE score and not the underlying problems – sounds simple, but as is the case with using performance indicators in general, users sometimes forget that the whole point of these indicators is to drive corrective action. When your child’s temperature is 104, you need to act, not simply note that it is 6 degrees too high.
By the way, there is no universal target OEE number. 85 is a great OEE (95%A x 95%T x 95%Q), but what is more important than the OEE value is to see a positive change in OEE over time as a result of the actions you’ve taken to improve your equipment’s performance. Likewise, benchmarks are handy for indicating what is possible and where you might look for more improvements but step one is to get an honest measure of your own performance. OEE is a great place to start.
If you were interested in this article, you may be interested in:
- Choosing the Right Maintenance Approaches for Your Organization
- Understanding Preventive and Predictive Maintenance
- Best Practices in Preventive Maintenance: How One Company Did It
- How can my facility benefit from Connecticut’s PRIME program?